How to Bridge Modbus to MQTT: Step-by-Step Guide
Build a Production-Ready Modbus to MQTT Bridge with Node-RED

Converting Modbus to MQTT unlocks the value trapped in legacy industrial equipment. Industrial facilities worldwide face a persistent challenge: their Modbus-based sensors, PLCs, and controllers generate valuable operational data, but that data remains isolated in local control networks, unable to feed modern cloud analytics, remote dashboards, or predictive maintenance systems.
We've built Modbus to MQTT bridges for manufacturing plants ranging from small production lines to enterprise-scale facilities, and the root problem is always the same protocol mismatch. Modbus requires a master-slave architecture with polling—one device requests data, another responds. MQTT enables publish-subscribe messaging—devices push data to a central broker where any authorized application can subscribe. These are fundamentally incompatible communication patterns.
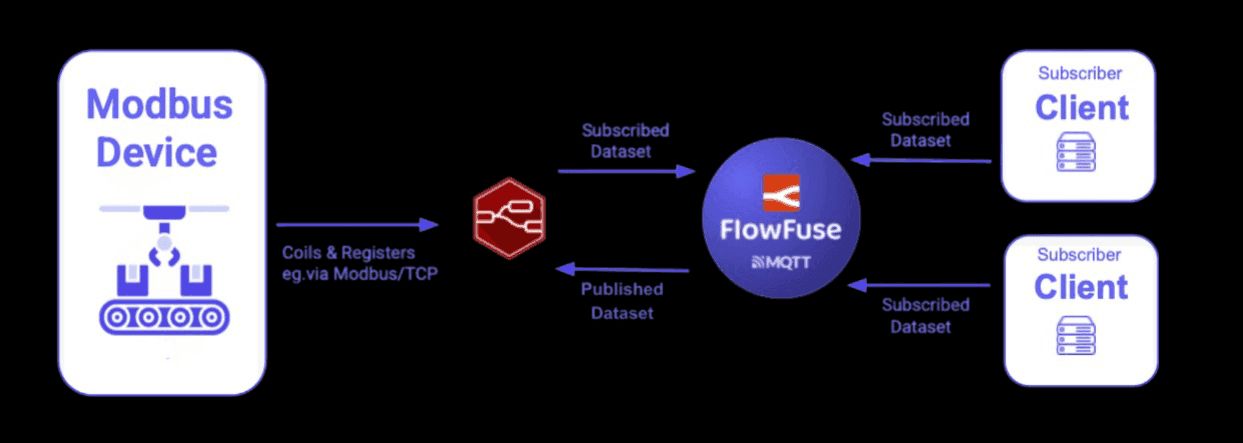
The proven solution is protocol bridging with Node-RED. This guide shows you how to build a reliable Modbus to MQTT gateway that reads holding registers from your devices, transforms raw sensor readings into human-readable formats, and publishes structured data to a Unified Namespace using FlowFuse's integrated MQTT broker. You'll bridge the OT/IT gap and enable cloud integration, real-time monitoring, and data-driven decision-making across your operations.
Why Bridge Modbus to MQTT?
Modbus handles local device communication effectively. A PLC polls sensors, reads holding registers, writes control signals—standard automation workflows that have proven reliable for decades. The limitation appears when you need that same data elsewhere: in a cloud database, on a remote dashboard, or feeding a predictive maintenance algorithm.
The constraint is architectural. Modbus requires a master-slave relationship. One device initiates requests, others respond. You can't have multiple systems independently accessing the same Modbus device without coordination, and you can't push data—only pull it through polling. This creates the operational technology (OT) and information technology (IT) integration gap.
MQTT removes these constraints through its broker-based architecture. Devices publish data once to the broker. Any authorized system—whether on-premises or cloud-based—subscribes to relevant topics and receives updates. No polling loops, no master-slave coordination, no point-to-point connections to manage.
This is where the Unified Namespace concept becomes practical. Instead of data scattered across disconnected Modbus networks, PLCs, and SCADA systems, you establish a single MQTT broker as the central data hub. All operational data flows through standardized topics organized by facility hierarchy: enterprise/site/area/line/equipment. Applications consume what they need through subscriptions.
Consider a production line running legacy Modbus equipment—VFDs controlling motor speeds, pressure transmitters monitoring hydraulic systems, temperature sensors on critical bearings. Historically, this data stays within the local control network. Bridge it to MQTT, and suddenly the maintenance team accesses real-time vibration data on their tablets, the operations dashboard displays line efficiency metrics, and the cloud analytics platform builds predictive models from historical trends—all from the same data stream.
FlowFuse provides both the Node-RED runtime for building these bridges and the MQTT broker infrastructure for the Unified Namespace. The integration is straightforward: Node-RED flows poll Modbus devices and publish to FlowFuse's MQTT broker, where any authorized application can subscribe.
How to Bridge Modbus to MQTT
Let's look at the steps to bridge Modbus data to MQTT using FlowFuse, leveraging Node-RED's capabilities. The process involves retrieving data from a Modbus device (For Practical example, we are using OpenSim to simulate Modbus data), transforming and processing the data (e.g., scaling raw sensor data into human-readable formats), and sending it to your Unified Namespace.
Prerequisites
Before you start, make sure you have:
- Modbus data source: An actual Modbus device or a simulator like ModSim.
- Node-RED Instance: The easiest and production-ready option is FlowFuse—run Node-RED on edge devices, manage and build flows remotely with your team. Deploy, scale, and secure hundreds or thousands of instances with built-in team collaboration, version control, and production-grade features. Sign up here and follow this guide to run Node-RED with FlowFuse on your edge device. Alternatively, install Node-RED locally on hardware with access to your Modbus network.
- MQTT Broker: You need broker connection details (host, port, credentials). If you're using FlowFuse Pro or Enterprise, there's an integrated broker at
broker.flowfuse.cloud—just create a client in the platform and you're done.
Step 1: Collect Data from Modbus Devices
The first step is to collect data from your Modbus devices. To do this, you'll need to run Node-RED on your Device. If your Modbus device communicates via a serial port, Node-RED will need access to that port, which you can manage with the appropriate configuration. If you're using Modbus TCP and both Node-RED and your Modbus device are on the same network, the connection is straightforward.
Step 1.1: Running the FlowFuse device agent on your edge device
To run Node-RED on your edge device with just a few simple steps, you can use the FlowFuse Device Agent. This allows you to run Node-RED locally and also connect it to FlowFuse Cloud for remote monitoring and management, making it easier to keep track of your devices and workflows from anywhere.
Step 1.2: Install Modbus Nodes
While Node-RED doesn't include Modbus nodes by default, adding them to your palette is simple. Installing the necessary Modbus nodes from the Node-RED library will enable communication with your Modbus devices, whether they’re connected via serial or TCP. This step ensures you can start reading data from your Modbus devices and processing it for further integration.
- Open the Palette Manager by clicking the menu icon in the top-right corner of Node-RED and selecting Palette Manager.
- In the Palette Manager, search for
node-red-contrib-modbusin the search bar. - Click Install to add the Modbus nodes to your Node-RED environment.
- Once installed, the nodes appear in the left-side palette under the Modbus category. These nodes will allow you to interact with Modbus devices in your flow.
Step 1.3: Configure the Modbus Connection
Next, you'll need to configure the Modbus connection based on your device type. Modbus devices can communicate using two primary protocols: Modbus RTU (over serial) or Modbus TCP (over Ethernet/Wi-Fi). The specific choice depends on the type of Device you are working with.
- Drag a Modbus Read node onto your Node-RED Canvas.
- Double-click on the Modbus Read node to open its configuration.
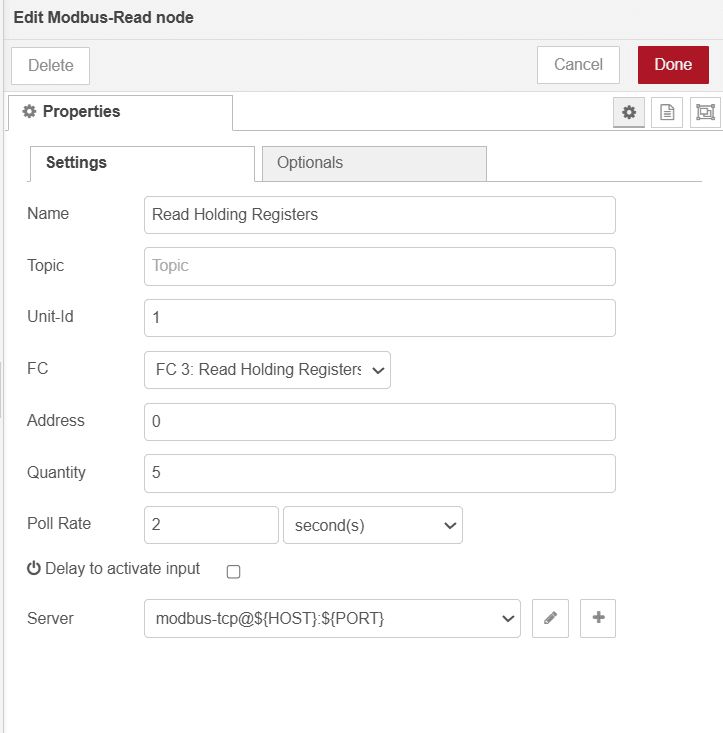
- In the configuration window:
- Enter the Unit ID (this is the device address, typically 1, but it may vary depending on your device).
- Choose the Function you need, such as Read Holding Registers, Read Input Registers, etc. (this depends on the type of data you want to read).
- Specify the Start Address (the address of the first register you want to start reading).
- Set the Quantity (the number of registers to read).
- Specify the Poll Rate (e.g., how often you want to collect data, such as every 1 second).
- In the Server field, click the + button to add a new Modbus server, and select the type.
- For Modbus TCP: Enter the IP address and Port (the default Modbus TCP port is 502).
- For Modbus RTU: If you're using a serial connection, you'll need to specify the serial port (such as
/dev/ttyUSB0on Linux orCOM1on Windows), as well as the baud rate and other serial settings. - Set the Unit ID (again, this should match the Unit ID you entered earlier).
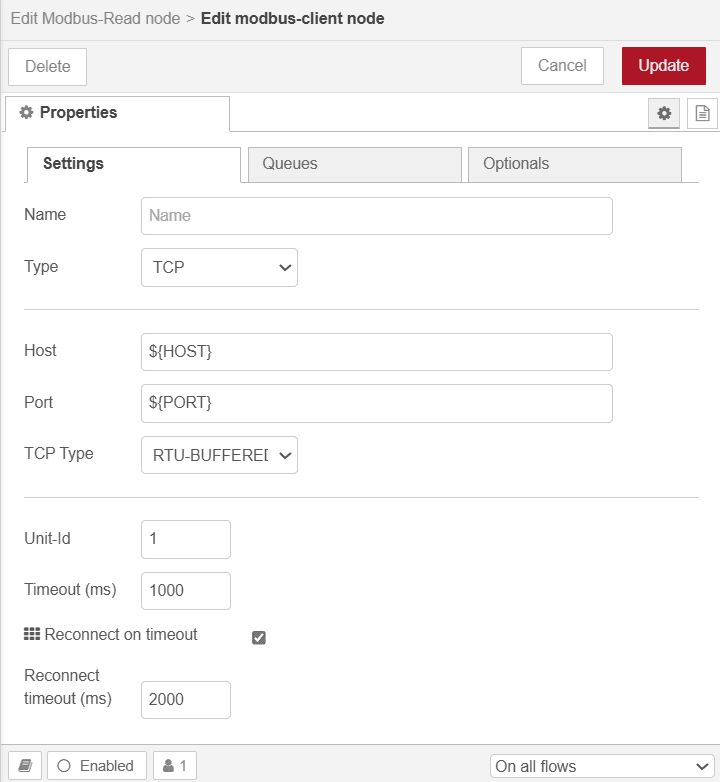
- Once the connection details are filled in, click Add to save the configuration, then click Done.
Step 1.4: Test the Modbus Connection
After configuring the connection, it's time to test the data collection.
- Drag a Debug node onto the canvas.
- Connect the Modbus Read node's output to to the input of Debug node.
- Click Deploy in the top-right corner of Node-RED to deploy your flow.
- Open the Debug Panel on the right side of the Node-RED interface. If the connection is successful, you should see the raw data from your Modbus device in the Debug Panel.
If no data appears, check the connection settings (IP address, Unit ID, port, etc.) and ensure your Modbus device is correctly configured and accessible. If you use a simulator like ModSim, ensure it’s running and properly configured to send data.
For more information on using Modbus with Node-RED, please read our tutorial on Using Modbus with Node-RED.
If you prefer a video explanation, Kurt Braun from WAGO demonstrates how to collect Modbus data using Node-RED in FlowFuse:
Step 2: Transforming Modbus Data for UNS
After collecting data from your Modbus device, the next step is transforming it into a usable format for cloud-based IoT applications. Modbus data typically comes in raw register values, and you may need to convert these values into human-readable formats like temperature, pressure, or other measurements.
Let's walk through the transformation process step by step.
Step 2.1: Parsing and Converting Raw Modbus Data
Modbus devices often return data in registers that need to be interpreted. For example, a temperature sensor might return a register value like 350, which represents 35.0°C if the sensor stores values in tenths of degrees.
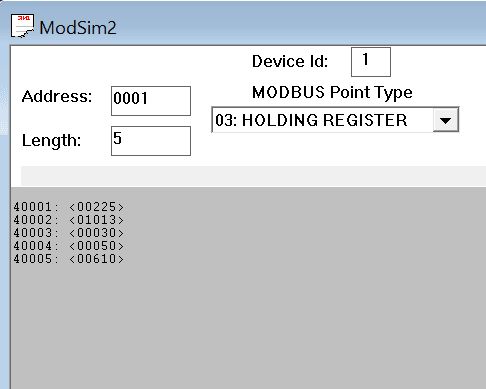
Here’s an example of the raw Modbus data I am receiving from ModSim: [225, 1013, 29, 50, 603]. These values represent the following:
225: Temperature (in tenths of degrees, which would be 22.5°C)1013: Part 1 of the pressure value (higher register)29: Part 2 of the pressure value (lower register)50: Vibration (in tenths of degrees, which would be 5g)603: Humidity (in tenths of degrees, which would be 60.3%)
We must convert these raw register values into human-readable formats for cloud integration. For instance, we divide the temperature and vibration by 10 to get the actual values in degrees Celsius and g, respectively, and similarly for other parameters like humidity. For pressure, the higher and lower register values are combined to compute the complete value accurately.
To determine how to process raw Modbus data, such as dividing by a specific value, concatenating, or applying other transformation formulas, refer to the manual of the sensor you use for specific instructions.
In Node-RED, you can use various nodes for transformation. You can choose the Function node for advanced processing, the Change node for simpler operations, or the Template node for defining schemas. For more complex data parsing scenarios—such as handling multiple data types (floats, 32-bit integers, strings), dealing with big-endian/little-endian conversions, or performing byte swapping—consider using the node-red-contrib-buffer-parser node. This specialized node simplifies parsing Modbus buffers into various data formats without writing custom code. Learn more in our guide on using Buffer Parser for industrial data. In this article, I will demonstrate a low-code approach using the Change node to process the data cleanly.
Additionally, for better organization and accessibility, I will send each metric separately and include additional metadata such as the timestamp and unit.
For Temperature:
- Drag a Change node onto the canvas.
- Double-click the node to open its configuration panel.
- Set the following in the Set rules:
- Set
msg.datatomsg.payload. - Set
msg.payloadto{}. - Set
msg.payload.timestampto the timestamp function of the Change node. - Set
msg.payload.valuetodata[0] / 10. - Set
msg.payload.unitto'c'.
- Set
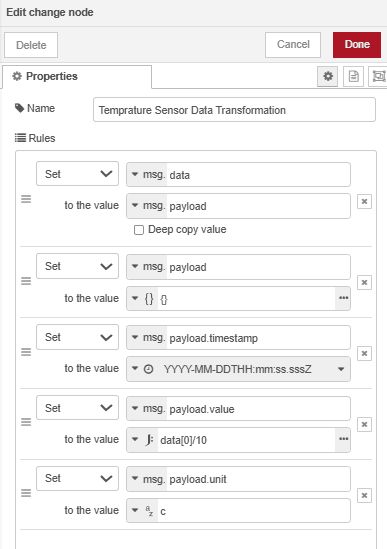
- Click Done to save the configuration.
- Connect the first output of the Modbus Read node to the input of this Change node.
For Pressure:
- Drag another Change node onto the canvas.
- Double-click the node to open its configuration panel.
- Set the following in the Set rules:
- Set
msg.datatomsg.payload. - Set
msg.payloadto{}. - Set
msg.payload.timestampto the timestamp function of the Change node. - Set
msg.payload.valueto$number($string(data[1]) & $string(data[2]))as a JSONata expression. - Set
msg.payload.unitto'ppm'.
- Set
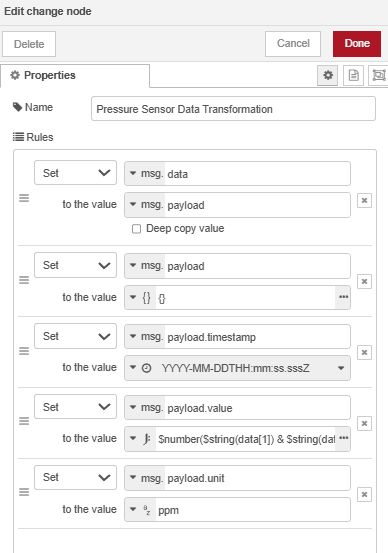
- Click Done to save the configuration.
- Connect the first output of the Modbus Read node to the input of this Change node.
For Vibration
- Drag another Change node onto the canvas.
- Double-click the node to open its configuration panel.
- Set the following in the Set rules:
- Set
msg.datatomsg.payload. - Set
msg.payloadto{}. - Set
msg.payload.timestampto the timestamp function of the Change node. - Set
msg.payload.valuetodata[3] / 10as a JSONata expression. - Set
msg.payload.unitto'g'.
- Set
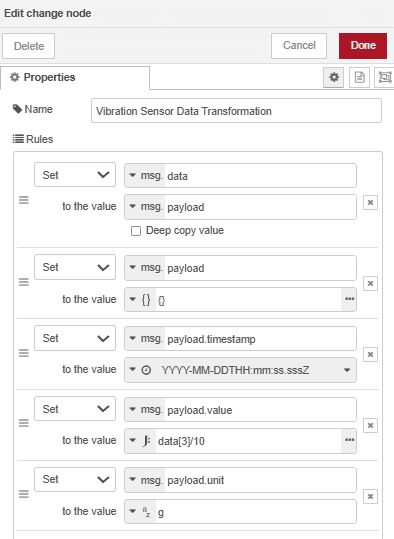
- Click Done to save the configuration.
- Connect the first output of the Modbus Read node to the input of this Change node.
For Humidity
- Drag another Change node onto the canvas.
- Double-click the node to open its configuration panel.
- Set the following in the Set rules:
- Set
msg.datatomsg.payload. - Set
msg.payloadto{}. - Set
msg.payload.timestampto the timestamp function of the Change node. - Set
msg.payload.valuetodata[4] / 10as a JSONata expression. - Set
msg.payload.unitto'%'.
- Set
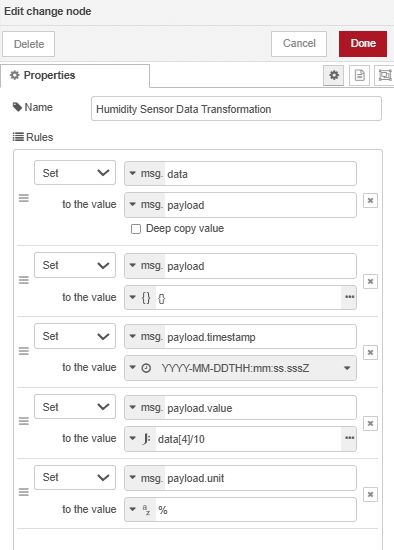
- Click Done to save the configuration.
- Connect the first output of the Modbus Read node to the input of this Change node.
Once you have configured and connected all the Change nodes, add a Debug node to each Change node's output to verify that the transformed data appears as expected. Deploy the flow, then check the output in the Debug Panel to ensure that each metric is correctly formatted with the appropriate timestamp, value, and unit.
Step 3: Publishing Modbus Data to MQTT
After transforming the Modbus data into a human-readable format, the next step is to publish it via MQTT to build your Unified Namespace (UNS). The UNS is created by organizing your MQTT topics into a standardized hierarchy—when you publish data to these structured topics, you're establishing the namespace that other systems can subscribe to.
Step 3.1: Preparing Your MQTT Broker
As mentioned in the prerequisites, FlowFuse provides an integrated MQTT broker service for Team and Enterprise users. The broker uses username and password authentication—you create clients on the platform with credentials that control topic access.
To create MQTT clients:
- Navigate to the FlowFuse platform and click Broker in the left sidebar.
- Click the Create Client button.
- Enter a username and password for the client.
- Configure topic access control patterns if needed, specifying which topics the client can publish to or subscribe from.
- Click Save to create the client.
- Once saved, copy the Client ID from the client list and save it for the next step.
For more details about the FlowFuse MQTT broker service, refer to the MQTT Broker Service Announcement.
Step 3.2: Configure MQTT Nodes
Now you'll configure Node-RED to publish your transformed Modbus data to the MQTT broker.
- In the Node-RED editor, drag an mqtt out node onto the canvas.
- Double-click the node, then click the + icon next to the Server field to add a new broker connection:
- Server: Enter
broker.flowfuse.cloud(for FlowFuse MQTT). - Port: Use the default MQTT port (1883 for non-TLS, 8883 for TLS).
- Client ID: Paste the Client ID you copied earlier.
- Username: Enter the username you created.
- Password: Enter the password you created.
- Server: Enter
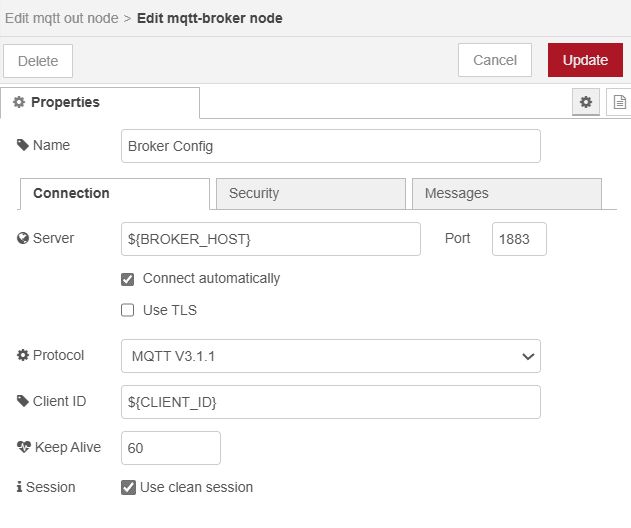
- Click Add to save the broker configuration.
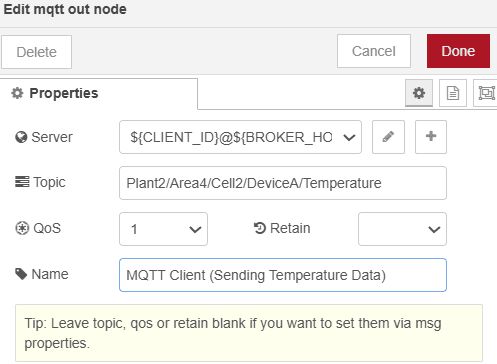
- Back in the mqtt out node configuration:
- Topic: Enter a topic following the ISA-95 equipment hierarchy, such as
plant2/Area4/Cell2/DeviceA/temperature. This naming convention organizes data by enterprise, site, area, line, and equipment, making it easier to filter, manage, and scale your system as it grows. - QoS: Select the appropriate Quality of Service level:
- 0 (At most once) - Fastest, but no delivery guarantee
- 1 (At least once) - Ensures delivery, possible duplicates
- 2 (Exactly once) - Slowest, but guarantees single delivery
- Retain: Enable this if you want the broker to store the last message for new subscribers.
- Topic: Enter a topic following the ISA-95 equipment hierarchy, such as
Note: This example uses environment variables for sensitive configuration data to prevent accidental exposure when sharing flows. For more information, refer to Using Environment Variables with Node-RED.
- Click Done to save the node configuration.
- Connect the output of the Change node (which transforms your temperature data) to the input of this mqtt out node.
Using FlowFuse MQTT Nodes
If you're using the FlowFuse MQTT broker, FlowFuse provides specialized MQTT nodes that simplify configuration. These nodes automatically configure the broker connection details when you drop them onto the canvas—no manual setup of server address, Client ID, username, or password required. You also won't need to manually create clients in the broker; they're automatically created when you use these nodes. This streamlines the development process and reduces configuration errors. Learn more about FlowFuse MQTT nodes.
Step 3.3: Configure MQTT Nodes for Remaining Metrics
Repeat the configuration process for each metric (pressure, vibration, humidity), creating separate mqtt out nodes with unique topics:
- Pressure:
plant2/Area4/Cell2/DeviceA/pressure - Vibration:
plant2/Area4/Cell2/DeviceA/vibration - Humidity:
plant2/Area4/Cell2/DeviceA/humidity
Each mqtt out node should:
- Use the same broker configuration (click the pencil icon next to Server and select your existing broker)
- Have its own unique topic
- Be connected to the corresponding Change node output
Step 3.4: Deploy and Verify the Connection
-
Click Deploy in the top-right corner of Node-RED to activate your flow.
-
Check the status indicator beneath each mqtt out node:
- Green dot with "connected": Successfully connected and publishing data
- Red dot with "disconnected": Connection failed—check your broker credentials and network connectivity
- Yellow dot: Connecting or waiting for data
-
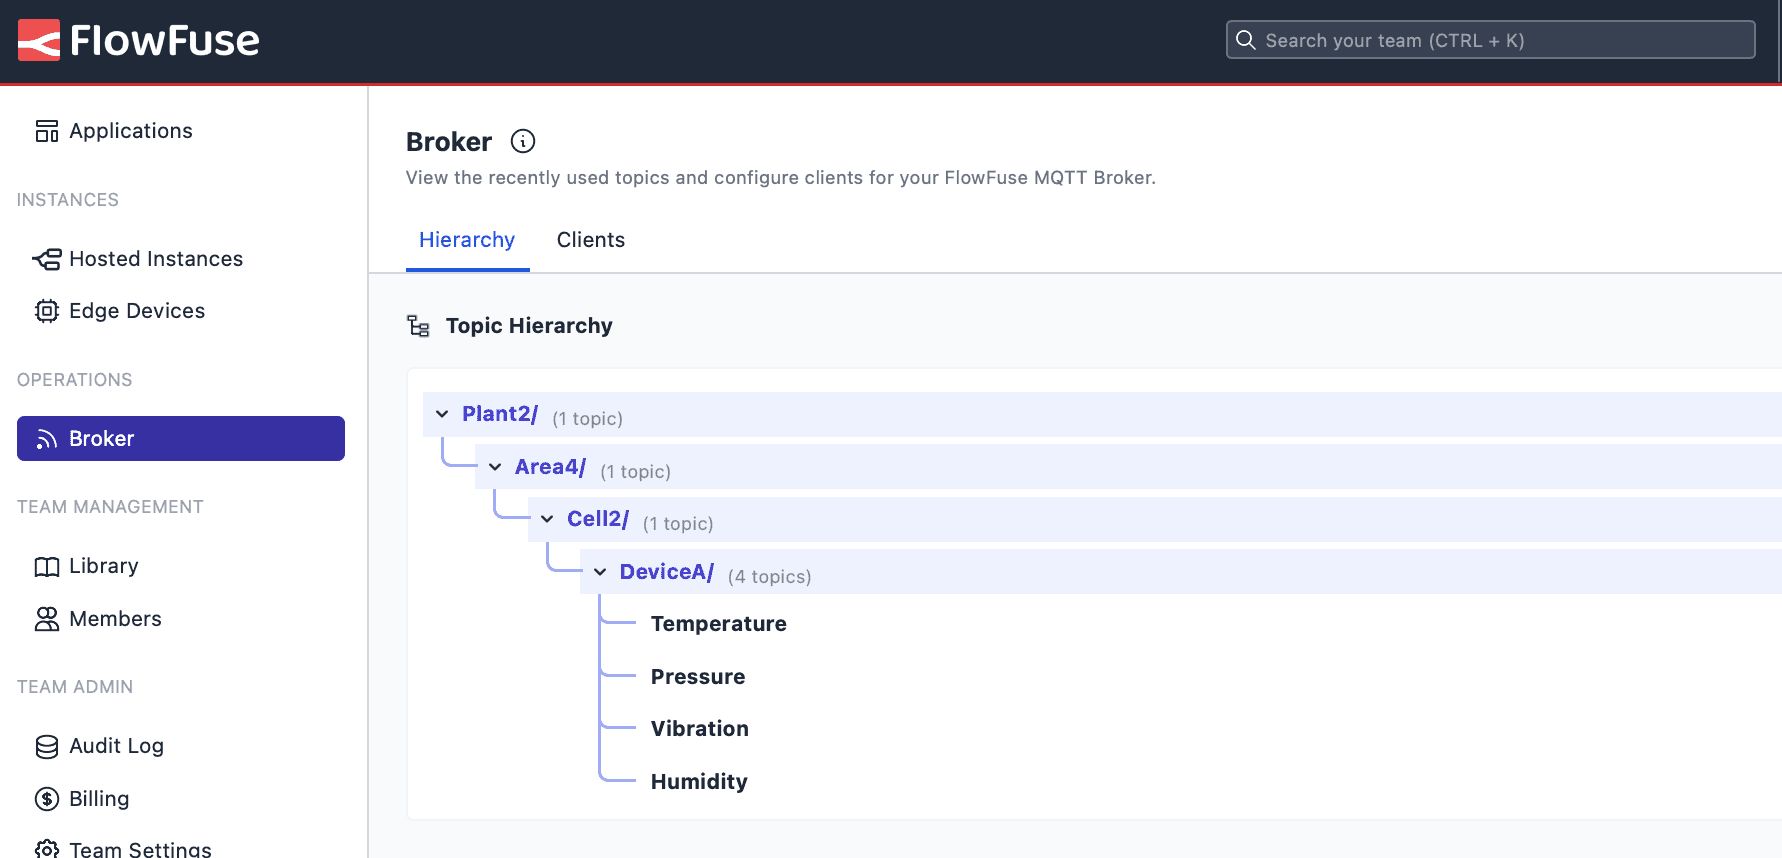
To verify data is flowing to your UNS:
- Navigate to the Broker section in the FlowFuse platform
- Click the Hierarchy tab to view your topic structure
- You should see your topics organized by the ISA-95 hierarchy you defined
Once your flow is successfully publishing data, you've established your Unified Namespace. Other systems can now subscribe to these MQTT topics to consume the data for:
- Cloud analytics platforms for historical analysis and reporting
- FlowFuse Dashboard for real-time monitoring and visualization
- Predictive maintenance systems for equipment health monitoring
- Business intelligence tools for operational insights
- Alert and notification systems for automated responses to threshold breaches
This setup effectively bridges legacy Modbus devices with modern IoT infrastructure, enabling data-driven decision-making and unlocking the full potential of your industrial operations.
For more information on using MQTT with Node-RED, please read Using MQTT with Node-RED.
Frequently Asked Questions
Do I need FlowFuse to bridge Modbus to MQTT, or can I use standard Node-RED?
Why send each metric (temperature, pressure, vibration) to separate MQTT topics instead of one combined topic?
What's the difference between the standard MQTT nodes and FlowFuse MQTT nodes?
The article mentions ISA-95 hierarchy. Is this required, or can I use my own topic structure?
How do I determine the correct transformation formula for my Modbus data?
What polling rate should I use for the Modbus Read node?
Can I monitor multiple Modbus devices in the same Node-RED flow?
What does QoS in MQTT mean, and which should I use?
How do I verify my Unified Namespace is working correctly?
About the Author
Sumit Shinde
Technical Writer
Sumit is a Technical Writer at FlowFuse who helps engineers adopt Node-RED for industrial automation projects. He has authored over 100 articles covering industrial protocols (OPC UA, MQTT, Modbus), Unified Namespace architectures, and practical manufacturing solutions. Through his writing, he makes complex industrial concepts accessible, helping teams connect legacy equipment, build real-time dashboards, and implement Industry 4.0 strategies.
Related Articles:
- Agentic AI Reads OPC UA Servers So You Don't Have To
- Why Modbus Refuses to Die
- MQTT vs OPC UA: Why This Question Never Has a Straight Answer
- Beyond Kepware: Why Modern Industrial Connectivity Demands a Second Look
- FlowFuse 2.26: Bringing access-controls to your MCP nodes